Read the Content page and act on it
How to read the citation columns, find the pages with demand and no citations, record the change you make, and read the before and after.
The Content page is where measurement turns into a list of pages to work on, and where the work you do is read back against the citations that follow it. This guide reads the table, picks a page, records the change, and says what the before-and-after card can and cannot tell you.
Before you start
- A project with scans, and pages on the Content page from an import or from the pages your scans found cited.
- The traffic columns need Search Console and Google Analytics.
- The Content page is available on request. If you do not see "Content" in the sidebar, write to support.
Read the table
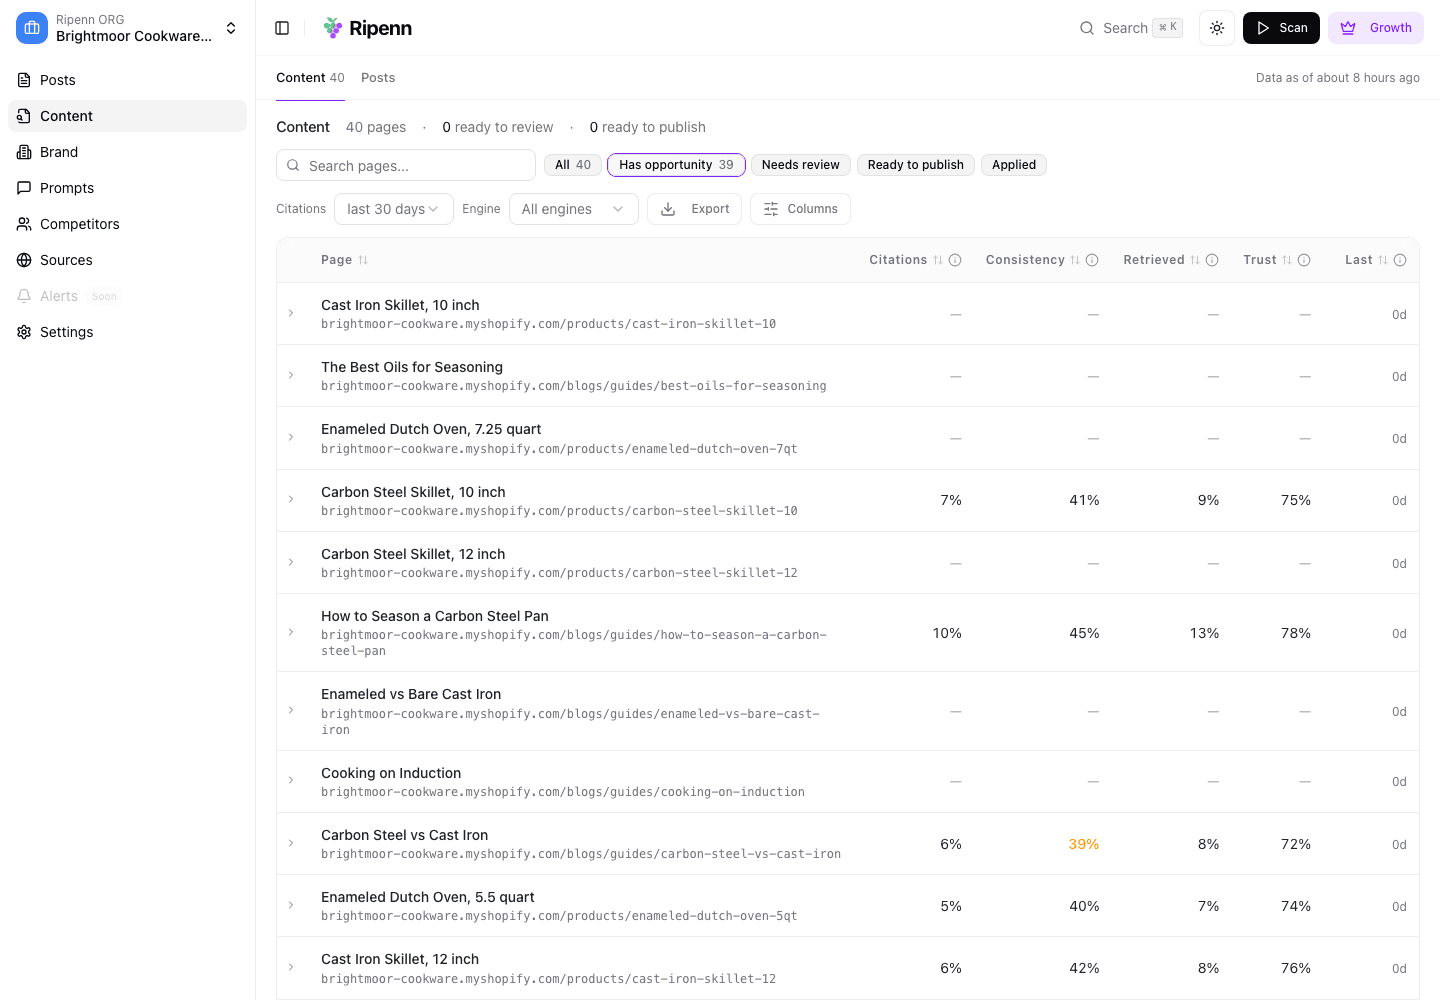
"Content" in the sidebar opens a table of your pages with a headline count and a "Data as of" line. Above it, the "Citations" selector sets the window the citation columns describe, from a week to all time, and "Engine" narrows them to one engine; the other filters are about suggested edits and can be ignored for now. "Columns" shows or hides columns and remembers your choice. Each column's heading explains itself when you hover it; in short:
- "Citations": of the scans run for a prompt, the share in which the page was cited at least once. The citation rate.
- "Consistency": when the page does surface for a question, how reliably it is cited across repeated asks. Low is shown in amber: a citation you cannot count on.
- "Retrieved": how often an engine fetched the page while researching, cited or not. "Trust": of those fetches, how often it went on to cite the page. Both exist only for engines that report which pages they looked at.
- "Clicks" and "Sessions": the last ninety days from Search Console and Google Analytics.
- "Opp": search demand the engines do not yet answer with this page, adjusted by how many of the page checks below the page fails.
- "Gaps": the seven page checks: enough words, one main heading, headings in order, question-style headings or FAQ markup, article markup (hidden code that tells engines what the page is), an author line and a sources section.
The table opens sorted by "Opp", highest first; any heading sorts, and pages with no value sit at the bottom whichever way you sort. A dash means no data for that page in that window, not a bad page.
Illustrative data from a demo project.
Pick the page
Press "Has opportunity". The filter keeps pages whose opportunity score is above zero and that have more than a few lines of text, which means pages with clicks that the engines cite little or not at all. The top of that list is the page to open first. In the demo project a guide to seasoning a carbon steel pan is a typical row: steady Search Console clicks, a low citation rate and a few gaps.
The arrow on a row opens the prompts that bring up the page, so you can see which questions it already answers before deciding what to change. Clicking a row opens the page view described next if the page was imported; a page the engines cite that you never imported opens a simpler view without the history chart or the action buttons.
What you will see on a page
The page view starts with a header: title, address, "Open live page", the citation rate for the window and which engines cite it, then four stats: opportunity as High, Medium or Low, traffic, page checks ("Compliant" or the number of gaps) and days since the last scan.
Under it, "Citation rate over time" draws the rate by day for a month and by week beyond that, with "Cited" and "Retrieved" toggles. Markers name the days you recorded an action, a re-import found the page changed, prompts were added or scan settings changed, so a move in the line has its candidates named. "Prompts this page targets" lists the prompts linked to the page, and "Link a prompt" adds one.
Record the action
When you rewrite or republish the page, press "Record an action". The dialog asks "What did you do" (created, updated, published, republished or removed), "Where" (website, blog, product page, a social channel, newsletter or other), "When", and an optional note. Backdate "When" if the work went live earlier: the windows split on that date, not on the day you fill it in. The note is for you in six weeks, when the line has moved and you want to know what you did.
Once each side has enough answers, about twenty, a card compares the four weeks before the action with the four weeks after, for the page and for the project, and reports whether the page pulled ahead of, fell behind, or moved in line with the project. A project scanning one engine once needs more scans to get there than one scanning four engines three times; until then the card says there are not enough runs yet.
The same loop runs from an AI assistant connected over MCP: ask it for the pages to work on, tell it what you changed and when so it writes the same record as "Record an action", have it link a prompt to a page, and ask it to read the before and after.
What to keep in mind
The before-and-after needs scans on both sides of the date, so a page you changed a week ago has nothing to say yet, and a project scanned weekly needs longer than one scanned daily.
Comparing the page with the project is how the card tells your change from a change in the engines; it is a comparison, not a proof. If both lines jump, something else moved.
Retrieved and Trust only cover engines that report which pages they read. The page checks look at the copy of the page from your last import, which is only as current as that import. And the opportunity score is a sort order, not a verdict: a page can rank high because it fails checks that do not matter for it.
Next
That is the loop from the app: a prompt set you trust, scans on a schedule, traffic and pages joined, and a record of what you changed. The last guide runs the same loop from a chat: Connect an AI assistant over MCP.
Written by